Home › Education

Vernier Graphical Analysis GW
Go Wireless sensor support
 US
US
1 of 1 storefronts
Content in en-US
Content in en-US
Information
Preview 2 platforms
iPhone 5 images


iPad 5 images



What’s New Version 4.0.6
• Support for iOS 13
• Various bug fixes and improvements
Description
Graphical Analysis™ GW is a tool for science students to collect, graph, and analyze data from Vernier Go Wireless® sensors.
Sensor data-collection support:
• Vernier Go Wireless® Temp and Go Wireless pH sensors
• Vernier Go Wireless Heart Rate and Go Wireless Exercise Heart Rate monitors
• Vernier LabQuest® sensors used with Go Wireless Link or LabQuest Stream interfaces
• Basic support for some Vernier Go Direct® Sensors
• NODE (by Variable Inc.) sensor support
Additional experiment options:
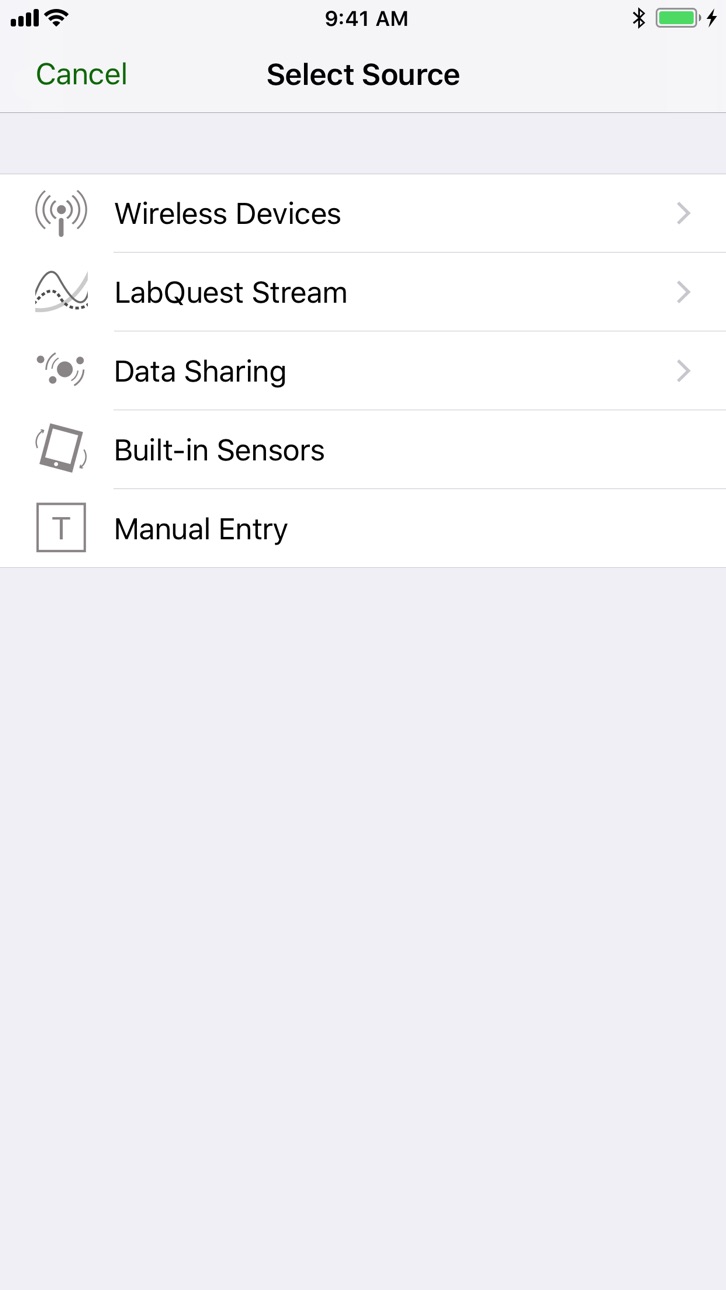
• Data Sharing via Wi-Fi connection to LabQuest 2 or Logger Pro® 3
• Built-in Sensors (accelerometers)
• Manual Entry
Note: Sensor data collection and Data Sharing require the purchase of hardware from Vernier Software & Technology. Built-in sensor and manual entry of data can be performed without a hardware purchase. For more information on Data Sharing, visit http://www.vernier.com/css
Key Features - Data Collection
• Multi-sensor data-collection support
• Time Based, Event Based, and Drop Counting data-collection modes
• Configurable data-collection rate and duration for time-based data collection
• Sensor calibrations
• Option to zero and reverse sensor readings
• Graph match feature for use with motion detectors
• Manual entry of data from keyboard and clipboard
Key Features - Data Analysis
• Display one, two, or three graphs simultaneously
• View data in a table or show a graph and table side-by-side
• Draw Predictions on a graph to uncover misconceptions
• Examine, interpolate/extrapolate, and select data
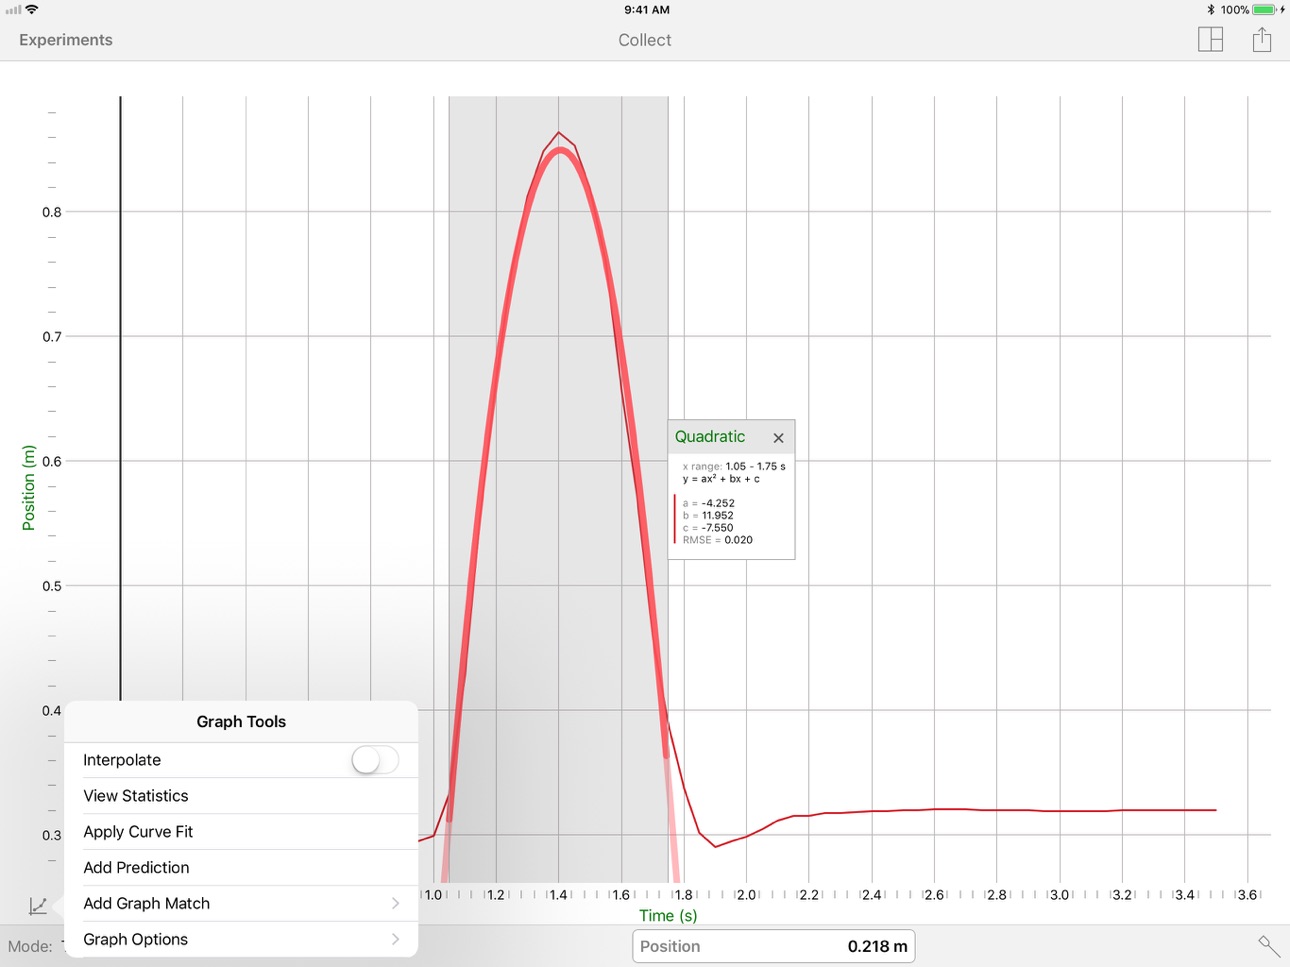
• Apply Statistics calculations to find mean, min, max, and standard deviation
• Perform curve fits, including linear, quadratic, natural exponent, and more
• Add calculated columns based on existing data to linearize data or investigate related concepts
• Pinch to scale graphs
Key Features - Collaboration and Sharing
• Add graph titles
• Export graphs and data for printing and inclusion in lab reports
• Export data in .CSV format for analysis of data in spreadsheet software such as Excel®, Google Sheets™, and Numbers®
Vernier Software & Technology has over 35 years of experience in providing effective learning resources for understanding experimental data in science and math classrooms. Graphical Analysis GW is a part of the extensive system of sensors, interfaces, and data-collection software from Vernier for science and STEM education.
Accessibility
ipadiphonemacrealityDevicetvoswatch
Version history 25 versions
Build 828259456v4.0.62019-11-27 03:27:51
• Support for iOS 13
• Various bug fixes and improvements
Build 828180293v4.0.52018-08-10 23:56:43
Fixes a bug which caused certain internationalized versions to crash.
Build 827167574v4.0.42018-08-09 17:35:57
• Various bug fixes and improvements
Build 825710806v4.0.32018-03-06 15:57:13
• User-Defined Calculated Columns
• Drop Counter support
• Various bug fixes and improvements
Build 824140676v4.0.22017-11-13 18:11:22
• Collect data from multiple Go Wireless and Go Direct sensors
• Support for iOS 11
• Various bug fixes and improvements
• This is the last update of Graphical Analysis for devices running iOS 9. Future updates will require iOS 10 or newer
Build 823530154v4.0.12017-09-06 20:46:08
• Support for Colorimeter sensors
• Ability to reconnect to a LabQuest Stream
• Interpolate Curve Fits
• Various bug fixes and improvements
Build 822965072v4.02017-07-21 22:25:07
• Revised Data Analysis Tools
• Analyze data within the current graph range without selecting a region first
• Statistics and Curve Fit tools accessed from Graph Tools menu
• Supports 10-second data averaging with event-based data collection
• Initial Go Direct support
Build 820876448v3.22017-02-24 13:58:29
• Reintroduced adding columns to a Manual Entry experiment
• Implemented support for multiple data sets in a Manual Entry experiment
• New functionality to add manual entry columns to sensor-based experiments
• Introduced Column Options for renaming columns from the data table
• Added Selected Events option for Event-Based data collection
• New position and velocity Graph Match feature for use with Motion Detectors
• Added Czech support
Build 819082413v3.12016-11-03 21:53:28
• Support for additional sensors
• User editable data collection settings (Mode, Rate, and Duration)
• Live sensor calibration
• Improved Table View
• Support for iOS 10
• Various bug fixes and improvements
Build 818555012v3.0.12016-08-19 17:02:30
Various bug fixes and improvements.
Build 817271794v3.02016-06-24 21:50:44
Graphical Analysis now works with LabQuest Stream™, a multi-channel interface with Bluetooth® technology that is compatible with more than 50 Vernier sensors, including
• Motion Detector
• Microphone
Build 815542930v2.52016-03-02 17:18:55
• Multiple Events with Entry data collection data sets are now possible
• Additional data can be appended to the most recent Events with Entry data set
• Precision of user-entered data is now respected in Events with Entry collection
Build 813684212v2.4.22015-10-14 14:38:18
Various bug fixes and improvements.
Build 813595127v2.4.12015-10-06 21:06:20
• Support for iOS 9
• Various bug fixes and improvements
Build 812932824v2.42015-09-17 21:04:07
• Collect sensor data as a function of an independent variable entered by the user. This data collection mode is known as Events with Entry.
• Added support for additional sensors, including Vernier Accelerometers, the Pressure Sensor 400, and the Glass Conductivity Sensor.
• Sensors can be zeroed before data collection.
• A new live readout field provides the current sensor value, even when not collecting data.
• New icons for Graph Options and View for consistency with other Vernier products.
Build 812725643v2.3.22015-07-01 20:29:20
• Raised maximum data rate of Go Wireless Link to 20 Hz.
• New firmware for Vernier Go Wireless Link hardware to resolve issue with identification of certain sensors.
Build 812473862v2.3.12015-05-28 20:41:52
• Raised maximum data rate of Go Wireless Link to 10 Hz.
• Added support for Stainless Steel Temperature Sensor and Voltage Probe.
• Various stability and performance enhancements.
Build 812324413v2.32015-05-15 19:29:36
• Support for Go Wireless Link
• Resolves a crash at launch for some users.
• Update to Go Wireless Temp firmware
• Removed "Always Delete History on Launch" from Settings. Added clearer text for one-time delete option.
Build 811381039v2.22015-02-23 21:04:13
- Support for Go Wireless pH and Go Wireless Heart Rate
- New titration mode with table and graph
- Tap the name of any experiment in your collection to rename it
- Optimized for iPhone 6/6 plus
- Improved accessibility
- Speed and performance improvements
- Fix for unresponsive keyboard when renaming Go Wireless devices
- Fix for display issues when editing columns in manual entry (landscape)
- Fix for invalid correlation values for linear fit
Build 711324757v2.1.22014-11-10 19:45:51
- Support for Go Wireless Temp firmware update (1.91)
- Import from Go Wireless app supports description and observation fields
- Import from CSV supports non-numeric entries
Note: Future versions of Graphical Analysis will require iOS 8.
Build 654503193v2.1.12014-08-01 21:54:11
Support for NODE CO2 and Thermocouple.
Build 544122700v2.12014-04-27 07:48:11
Graphical Analysis now supports iPhone and iPod touch!
Other improvements
• Reconnect to Experiment data sources with the tap of a button.
• Scrolling in y-axis and x-axis areas has been disabled to reduce interference with other gestures.
• Fixed a scaling issue for wireless sensor data collection longer than 600 s.
• Fixed an issue with manual scaling on built-in sensors.
• Shared CSV no longer includes prediction data.
• Fixed issue with "new run" badges displaying on wireless and built-in sensors.
• Usability improvement for Curve Fit options.
• Fixed an issue with Data Sharing and user selections.
-Warning-
If you are currently using a version of Graphical Analysis older than 1.5, please do NOT update Graphical Analysis until after you have exported your important data. There is a chance that updating directly from older versions of Graphical Analysis (before 1.5) will result in the loss of your saved experiments. For any questions, please contact support@vernier.com
Improvements in previous versions (2.0.2 and 2.0.1)
• Data collection from wireless sensors continues in the background.
• 64-bit support
• Interface visual refinements
• Improved import and export of CSV (to support regional formats)
• Motion data imported from Video Physics now displays position and velocity graphs in that order
• Improved default Experiment names
Build 476892645v2.0.22014-03-25 18:10:15
Improvements in 2.0.2:
• Data collection from wireless sensors continues in the background.
• 64-bit support
• Interface visual refinements
• Improved import and export of CSV (to support regional formats)
• Motion data imported from Video Physics now displays position and velocity graphs in that order.
• Fixed an issue with the naming of new built-in sensor experiments.
Here's what's new in Graphical Analysis 2.0:
Support for wireless sensors:
• NEW Vernier Go Wireless Temp and NODE allow for wireless sensor data collection and analysis. Find out more at vernier.com/ipad
Complete redesign:
• All your favorite features are readily available within a refined, uncluttered interface.
Experiments:
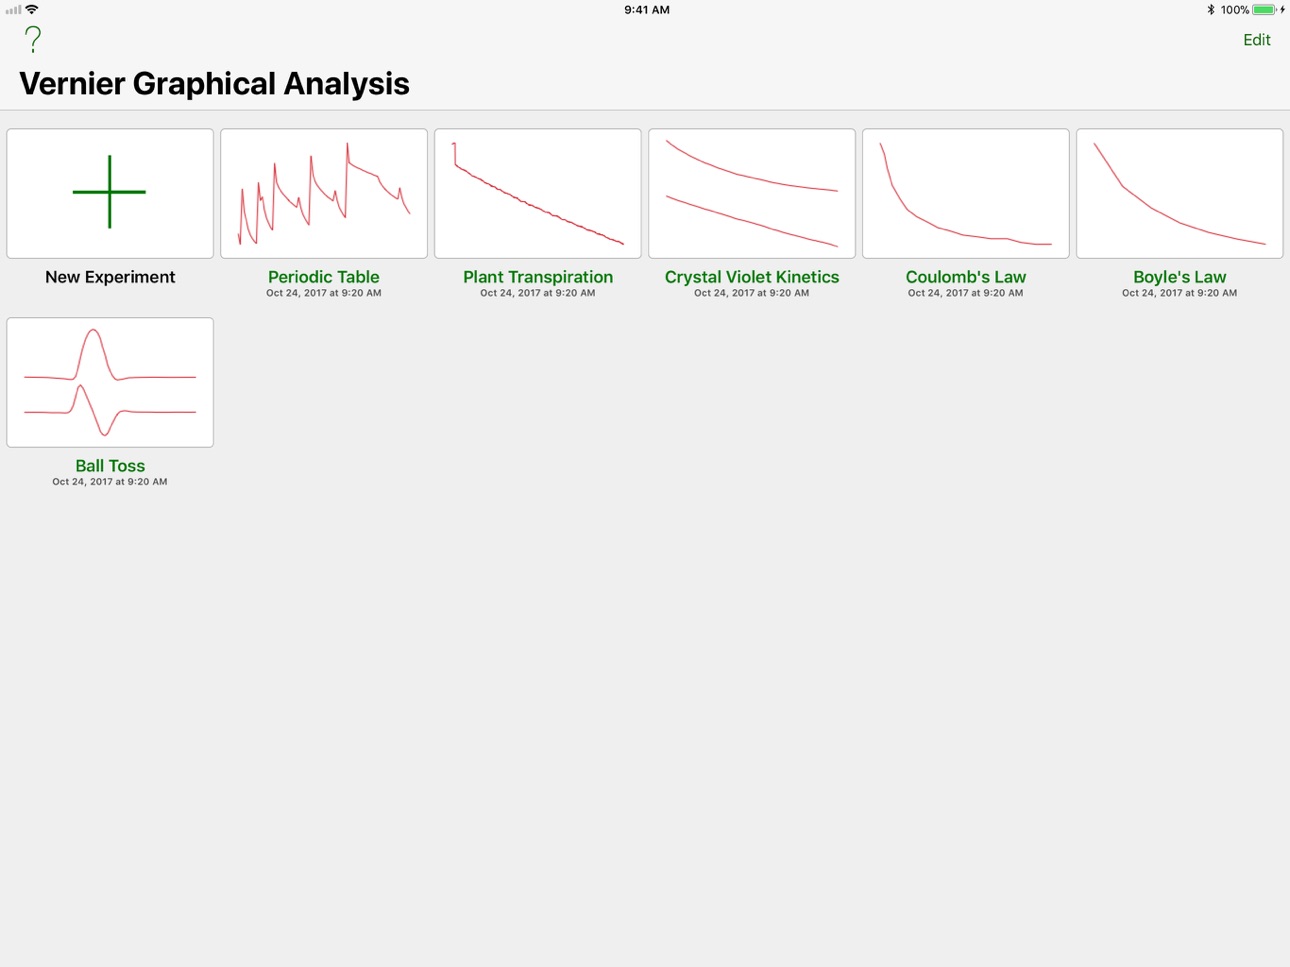
• View all your saved experiments in a collection. Create a new experiment with wireless sensors, LabQuest 2 Data Sharing, or manual entry.
Redesigned graphs:
• Understand your data with simple, uncluttered graphs and colors that are optimized for various levels of color vision sensitivity.
Simplified share tool:
• Share graphs from the graph view; share data from the table view.
Graph scaling:
• In addition to pinch-to-zoom, you can now set the graph ranges numerically for finer control.
Data collection:
• Data collection from wireless and built-in sensors continues until you press stop.
Thanks for all your support of Graphical Analysis! Please keep the feedback coming to support@vernier.com. If you like what we do, please take a minute to review or rate the app; it really helps!
Build 453682659v2.0.12014-03-14 18:50:24
2.0.1:
Fixed an issue with temperature readings below 0 °C.
Here's what's new in Graphical Analysis 2.0:
Support for wireless sensors:
• NEW Vernier Go Wireless Temp and NODE allow for wireless sensor data collection and analysis. Find out more at vernier.com/ipad
Complete redesign:
• All your favorite features are readily available within a refined, uncluttered interface.
Experiments:
• View all your saved experiments in a collection. Create a new experiment with wireless sensors, LabQuest 2 Data Sharing, or manual entry.
Redesigned graphs:
• Understand your data with simple, uncluttered graphs and colors that are optimized for various levels of color vision sensitivity.
Simplified share tool:
• Share graphs from the graph view; share data from the table view.
Graph scaling:
• In addition to pinch-to-zoom, you can now set the graph ranges numerically for finer control.
Data collection:
• Data collection from wireless and built-in sensors continues until you press stop.
Thanks for all your support of Graphical Analysis! If you have a moment to give us a boost, please review the app right here on the App Store. As always, we love to hear your feedback, comments, questions, and support requests via support@vernier.com.
Build 316872638v2.02014-03-06 15:22:03
Here's what's new in Graphical Analysis 2.0:
Support for wireless sensors:
• NEW Vernier Go Wireless Temp and NODE allow for wireless sensor data collection and analysis. Find out more at vernier.com/ipad
Complete redesign:
• All your favorite features are readily available within a refined, uncluttered interface.
Experiments:
• View all your saved experiments in a collection. Create a new experiment with wireless sensors, LabQuest 2 Data Sharing, or manual entry.
Redesigned graphs:
• Understand your data with simple, uncluttered graphs and colors that are optimized for various levels of color vision sensitivity.
Simplified share tool:
• Share graphs from the graph view; share data from the table view.
Graph scaling:
• In addition to pinch-to-zoom, you can now set the graph ranges numerically for finer control.
Data collection:
• Data collection from wireless and built-in sensors continues until you press stop.
Thanks for all your support of Graphical Analysis! If you have a moment to give us a boost, please review the app right here on the App Store. As always, we love to hear your feedback, comments, questions, and support requests via support@vernier.com.
No pricing data captured yet — comparisons appear once the app has paid storefronts or in-app purchases.
Availability 1 of 1 storefronts
| Region | Language | Price | Ratings | Avg | Version |
|---|---|---|---|---|---|
| US | en-US | Free | 158 | 2.4 | 4.0.6 |
Change log 29 changes · US
✎
releaseNotes updated
• Support for iOS 13
• Various bug fixes and improvements
✎
description updated
Graphical Analysis™ GW is a tool for science students to collect, graph, and analyze data from Vernier Go Wireless® sensors.
Sensor data-collection support:
•
✎
subtitle updated
Go Wireless sensor support
✎
name updated
Vernier Graphical Analysis GW
◆
Version 4.0.6 released
• Support for iOS 13
• Various bug fixes and improvements
◆
Version 4.0.5 released
Fixes a bug which caused certain internationalized versions to crash.
◆
Version 4.0.4 released
• Various bug fixes and improvements
◆
Version 4.0.3 released
• User-Defined Calculated Columns
• Drop Counter support
• Various bug fixes and improvements
◆
Version 4.0.2 released
• Collect data from multiple Go Wireless and Go Direct sensors
• Support for iOS 11
• Various bug fixes and improvements
• This is the last update of Graphical Analysis for devices running iOS 9. Future updates will require iOS 10 or newer
◆
Version 4.0.1 released
• Support for Colorimeter sensors
• Ability to reconnect to a LabQuest Stream
• Interpolate Curve Fits
• Various bug fixes and improvements
◆
Version 4.0 released
• Revised Data Analysis Tools
• Analyze data within the current graph range without selecting a region first
• Statistics and Curve Fit tools accessed from Graph Tools menu
• Supports 10-second data averaging with event-based data collectio
◆
Version 3.2 released
• Reintroduced adding columns to a Manual Entry experiment
• Implemented support for multiple data sets in a Manual Entry experiment
• New functionality to add manual entry columns to sensor-based experiments
• Introduced Column Options for
◆
Version 3.1 released
• Support for additional sensors
• User editable data collection settings (Mode, Rate, and Duration)
• Live sensor calibration
• Improved Table View
• Support for iOS 10
• Various bug fixes and improvements
◆
Version 3.0.1 released
Various bug fixes and improvements.
◆
Version 3.0 released
Graphical Analysis now works with LabQuest Stream™, a multi-channel interface with Bluetooth® technology that is compatible with more than 50 Vernier sensors, including
• Motion Detector
• Microphone
◆
Version 2.5 released
• Multiple Events with Entry data collection data sets are now possible
• Additional data can be appended to the most recent Events with Entry data set
• Precision of user-entered data is now respected in Events with Entry collection
◆
Version 2.4.2 released
Various bug fixes and improvements.
◆
Version 2.4.1 released
• Support for iOS 9
• Various bug fixes and improvements
◆
Version 2.4 released
• Collect sensor data as a function of an independent variable entered by the user. This data collection mode is known as Events with Entry.
• Added support for additional sensors, including Vernier Accelerometers, the Pressure Sensor 400,
◆
Version 2.3.2 released
• Raised maximum data rate of Go Wireless Link to 20 Hz.
• New firmware for Vernier Go Wireless Link hardware to resolve issue with identification of certain sensors.
◆
Version 2.3.1 released
• Raised maximum data rate of Go Wireless Link to 10 Hz.
• Added support for Stainless Steel Temperature Sensor and Voltage Probe.
• Various stability and performance enhancements.
◆
Version 2.3 released
• Support for Go Wireless Link
• Resolves a crash at launch for some users.
• Update to Go Wireless Temp firmware
• Removed "Always Delete History on Launch" from Settings. Added clearer text for one-time delete option.
◆
Version 2.2 released
- Support for Go Wireless pH and Go Wireless Heart Rate
- New titration mode with table and graph
- Tap the name of any experiment in your collection to rename it
- Optimized for iPhone 6/6 plus
- Improved accessibility
- Speed and performa
◆
Version 2.1.2 released
- Support for Go Wireless Temp firmware update (1.91)
- Import from Go Wireless app supports description and observation fields
- Import from CSV supports non-numeric entries
Note: Future versions of Graphical Analysis will require iOS 8.
◆
Version 2.1.1 released
Support for NODE CO2 and Thermocouple.
◆
Version 2.1 released
Graphical Analysis now supports iPhone and iPod touch!
Other improvements
• Reconnect to Experiment data sources with the tap of a button.
• Scrolling in y-axis and x-axis areas has been disabled to reduce interference with other gestures.
◆
Version 2.0.2 released
Improvements in 2.0.2:
• Data collection from wireless sensors continues in the background.
• 64-bit support
• Interface visual refinements
• Improved import and export of CSV (to support regional formats)
• Motion data imported from Video
◆
Version 2.0.1 released
2.0.1:
Fixed an issue with temperature readings below 0 °C.
Here's what's new in Graphical Analysis 2.0:
Support for wireless sensors:
• NEW Vernier Go Wireless Temp and NODE allow for wireless sensor data collection and analysis. Find
◆
Version 2.0 released
Here's what's new in Graphical Analysis 2.0:
Support for wireless sensors:
• NEW Vernier Go Wireless Temp and NODE allow for wireless sensor data collection and analysis. Find out more at vernier.com/ipad
Complete redesign:
• All your