Home › Education

 US
US
1 of 1 storefronts
Content in en-US
Content in en-US
Information
Apple ID332350406
Bundle IDcom.kybervision.MathGraphLE
SellerSeller
Min iOS7.1
Min macOS11.0
Device familiesiphone, ipod
Released2009-09-28
Copyright© 2016 KyberVision Japan LLC
WebsiteLink ↗
Preview 1 platform
iPhone 5 images


What’s New Version 2.0.1
This update from Apple will improve the functionality of this app. No new features are included.
Add a title and values of dynamic variables to tabulated data copied from the solver module
Additional functions: Student's t-distribution pdf and Chi-Square Distribution cdf functions
Shake the device to reset the axes with a 1:1 aspect ratio
Minor bug fixes in interface orientation change
Description
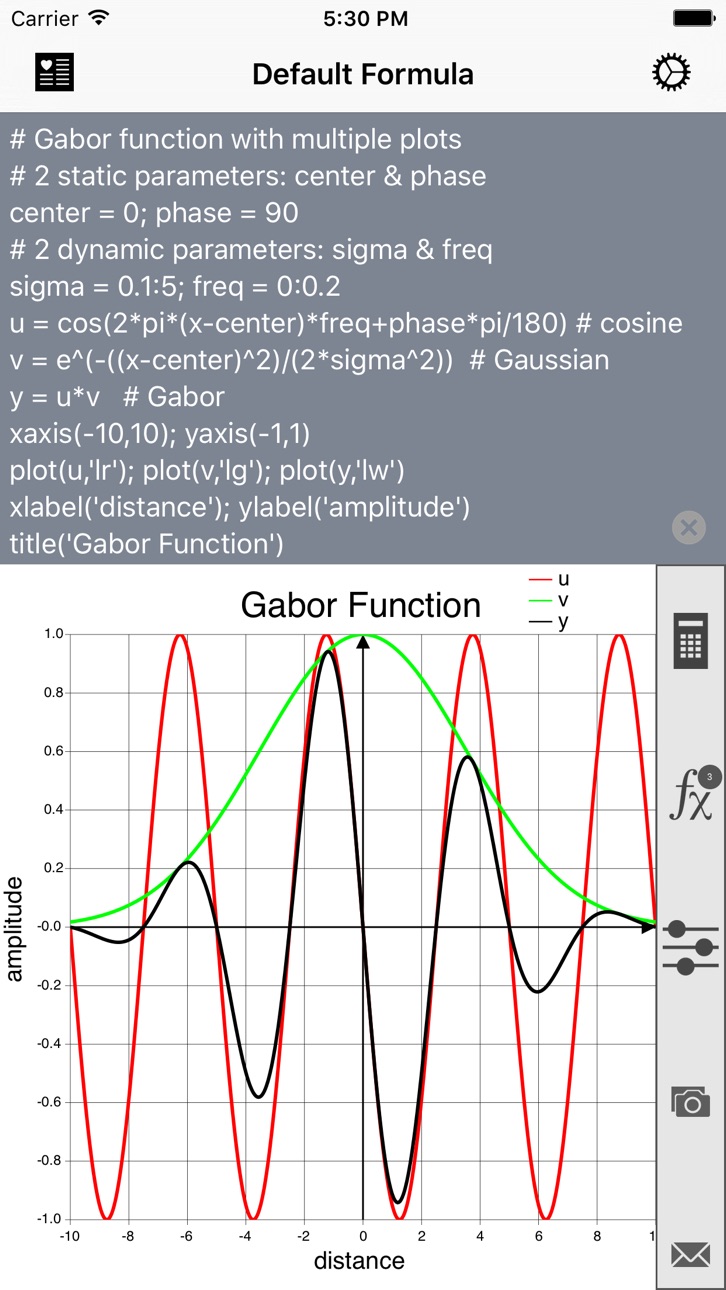
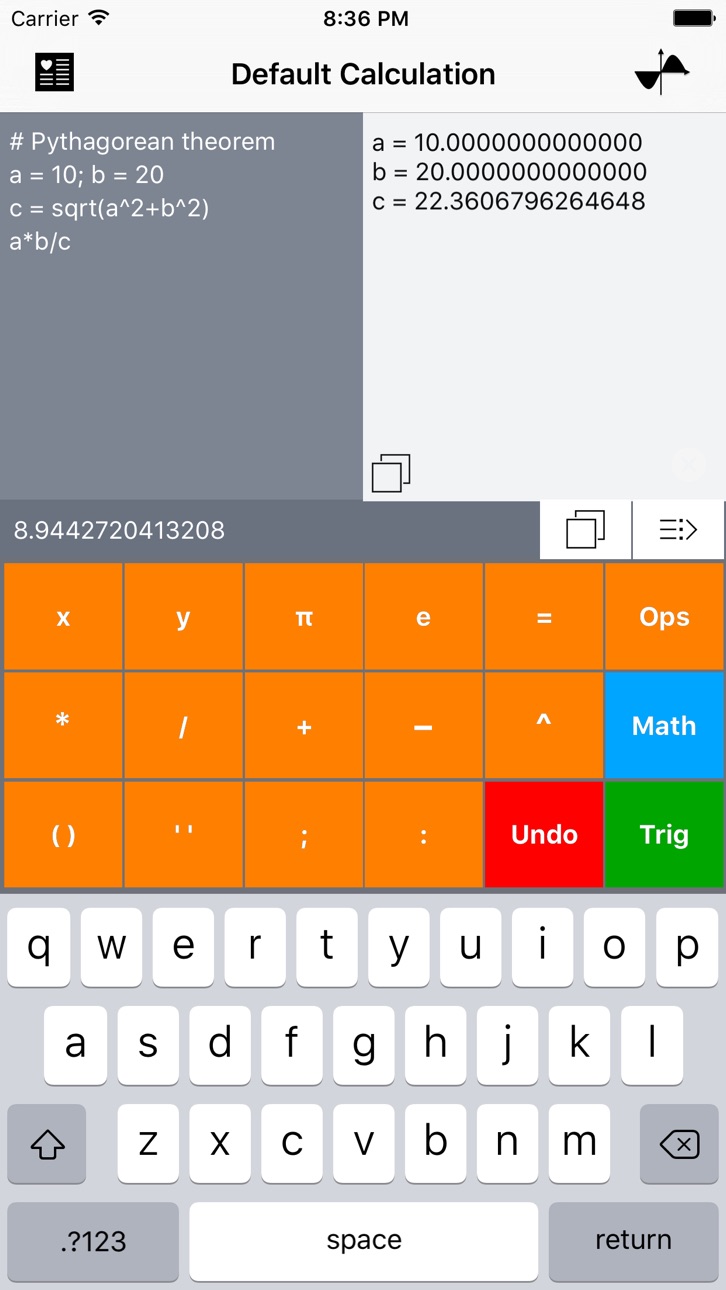
MATH GRAPHING 2.0 is a unique graphing app to plot simultaneously multiple mathematical expressions of arbitrary complexity using static and dynamic variables (including a time variable and random generation functions). It also includes a standard calculator mode that allows simultaneous evaluations of any number of intermediary variables.
"Math Graphing" can help students improve their math skills by developing some visual intuition of mathematical expressions or advanced users who need some scientific capabilities only available with expensive desktop software.
MATH GRAPHING provides the following functionalities:
- Multiple expressions with quasi-unlimited number of variables can be combined to produce simple or complex formulas.
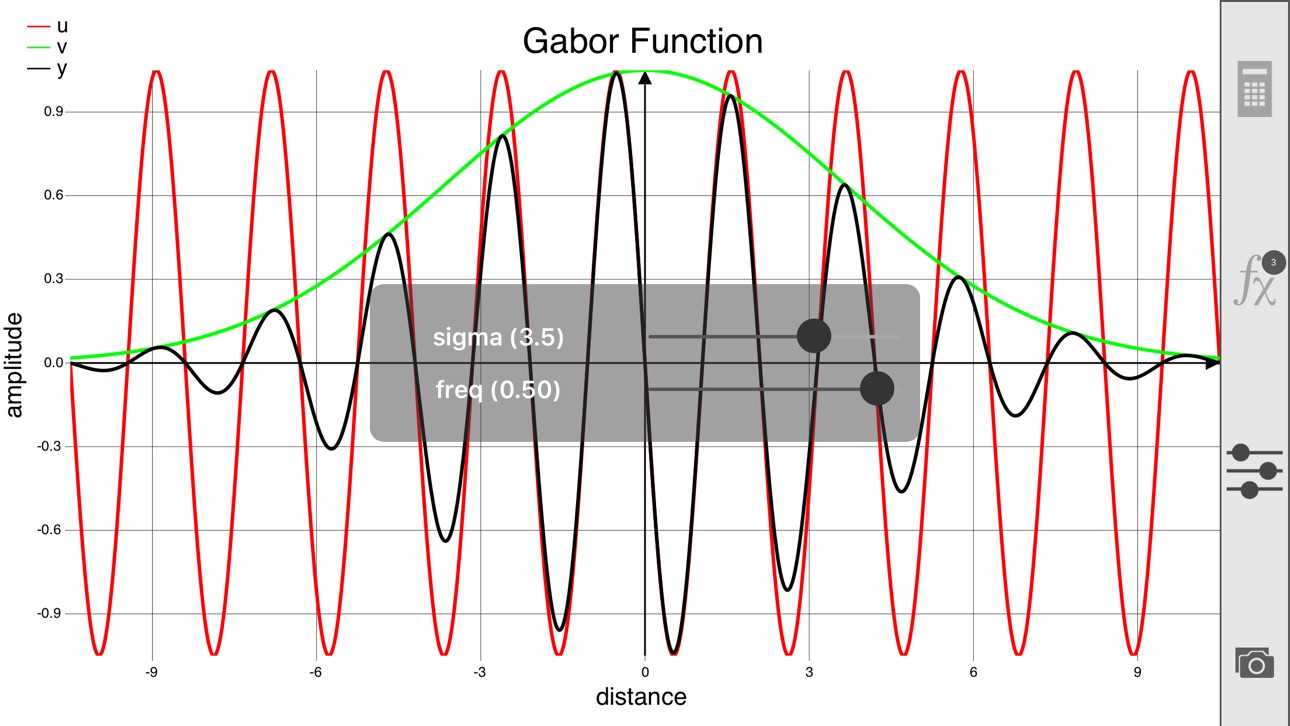
- Interactive sliders can be created to visually investigate the role of important parameters on the graphical representation of the formulas.
- Trace mode to display coordinates and derivative of marker on selected curve.
- Landscape mode for graphing.
- Solver tool to solve y = f(x) where x or y are unknown, local/global minima/maxima/extrema or intersections g(x) = f(x).
- Formula graphs can be saved to the device's Photos Album and the formulas can be exported through email with embedded graphs.
- Add any formula or calculation to your list of favorites (in-app purchase).
- Several formulas can be plotted simultaneously in different colors and styles.
- Customizable graph appearance: axes labels and ranges, title, curve color and style, ticks number, grid, legends, etc.
- A single-precision calculator supporting multiple variables.
Example of mathematical expression:
# Gabor function with multiple plots
# 2 static parameters: center & phase
center = 0; phase = 90
# 2 dynamic parameters: sigma & freq
sigma = 1:50; freq = 0:0.2
u = cos(2*pi*(x-50)*freq+phase*pi/180)
v = e^(-((x-center)^2)/(2*sigma^2))
y = u*v
plot(u,'lr'); plot(v,'lg'); plot(y,'lw')
xlabel('distance'); ylabel('amplitude')
title('Gabor Function')
Please visit our "Math Graphing" web page (http://ios.kybervision.com/mathgraphing/) to learn more about "Math Graphing"!
About KyberVision Japan LLC: we provide consulting, research and development services in Vision Sciences. We also develop vision-related applications for the iPad/iPhone/iPod Touch platform, that are spin-off products of Psykinematix, our Mac OS X flagship product in the field of Visual Psychophysics. Feel free to subscribe to our newsletter at http://iphone.kybervision.com.
In-App Purchases US pricing
One-Time Purchases
PowerUpgrade$1.99
Calculator Pack$2.99
Graphing Pack$2.99
PowerPack$4.99
Capabilities
In-App Purchases
Accessibility
ipadiphonemacrealityDevicetvoswatch
Version history 4 versions
Build 820230580v2.0.12016-12-20 00:23:00
This update from Apple will improve the functionality of this app. No new features are included.
Add a title and values of dynamic variables to tabulated data copied from the solver module
Additional functions: Student's t-distribution pdf and Chi-Square Distribution cdf functions
Shake the device to reset the axes with a 1:1 aspect ratio
Minor bug fixes in interface orientation change
Build 820106563v2.02016-12-16 01:04:31
Complete new design:
- iOS 10 compliant interface
- In-App Purchase options
- tip notifications
Improved compatibility:
- support for iOS 8, 9 and 10
- support for iPhone 5 to 7S screen size
Expression editing:
- additional functions: randn(), length(), std(), round(), Bessel, gamma, factorial, binomial, and error functions
- improved reporting and continuous checking of syntax & evaluation errors
- support for undo
- option for text size for formula and calculation
- optional iCloud backup of calculations and formulas
Graphing:
- axes range specification (through axis() & yaxis() commands)
- option for originated axes
- movable legend for plotted curves and related option
- separate tick numbers for x- and y-axes to allow rectangular grid
- more robust graphing with infinite or undefined evaluation
- better determination of axis tick values based on range and number of ticks
- export to table (through “None” Solver option)
- support for 'time' variable in formula
- improve display of touched data point on graph (through inspector with copy option and under sliders control)
- 1024 x 1024 export option
Solver:
- more reliable and precise solvers
- addition of intersection solver
- report number of solutions found and list them in a copyable table
Calculator:
- list management for calculations
- evaluation of each variable
Build 2060182v1.12009-10-31 19:13:09
Addition of xlabel, ylabel, and title commands to customize further the graph appearance.
Build 1985658v1.02009-09-28 17:37:37
Price history by region
Currency
Show
Columns
Search
Availability 1 of 1 storefronts
| Region | Language | Price | Ratings | Avg | Version |
|---|---|---|---|---|---|
| US | en-US | Free | 3 | 4.0 | 2.0.1 |
Change log 7 changes · US
✎
releaseNotes updated
This update from Apple will improve the functionality of this app. No new features are included.
Add a title and values of dynamic variables to tabulated data
✎
description updated
MATH GRAPHING 2.0 is a unique graphing app to plot simultaneously multiple mathematical expressions of arbitrary complexity using static and dynamic variables (
✎
name updated
Math Graphing Lite - Dynamic Scientific Calculator
◆
Version 2.0.1 released
This update from Apple will improve the functionality of this app. No new features are included.
Add a title and values of dynamic variables to tabulated data copied from the solver module
Additional functions: Student's t-distribution pdf
◆
Version 2.0 released
Complete new design:
- iOS 10 compliant interface
- In-App Purchase options
- tip notifications
Improved compatibility:
- support for iOS 8, 9 and 10
- support for iPhone 5 to 7S screen size
Expression editing:
- additional functions: ran
◆
Version 1.1 released
Addition of xlabel, ylabel, and title commands to customize further the graph appearance.
◆
Version 1.0 released